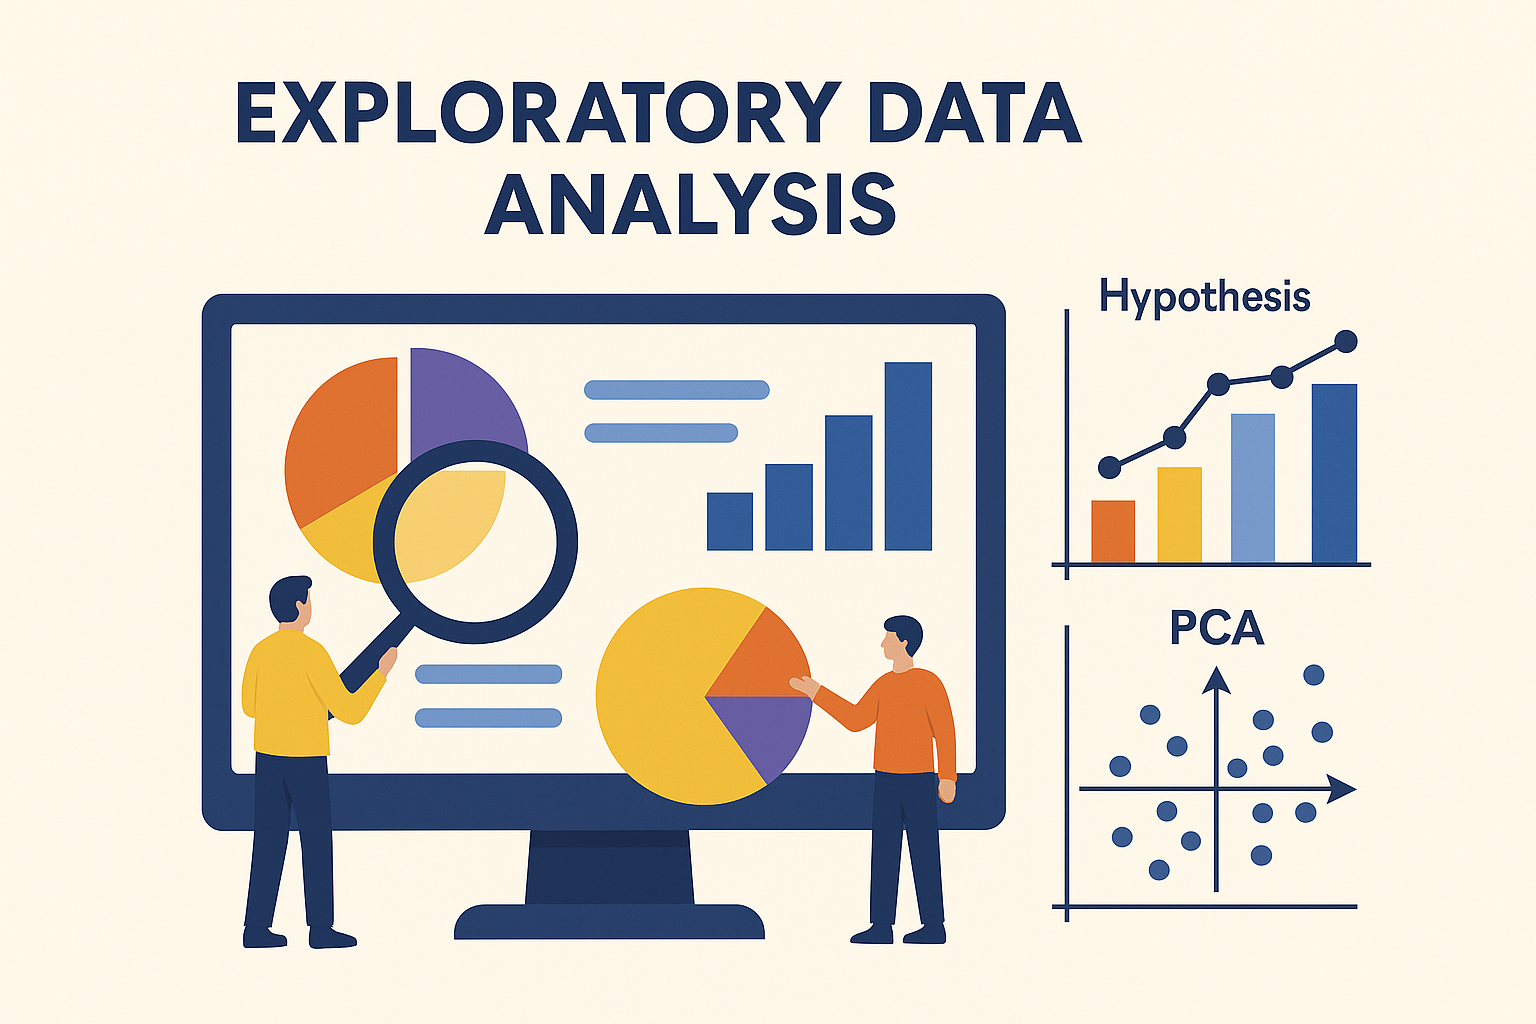
When you first dive into a dataset, you’re not just poking around for interesting patterns — you’re doing something fundamental called Exploratory Data Analysis (EDA). At its core, EDA has two big missions: to describe the data and to help formulate a model that can make sense of it.
Although the term “EDA” was famously coined by John Tukey in 1977, it might be even more helpful to think of it as Initial Data Analysis (IDA). Why? Because EDA isn’t just about getting a feel for the data — it’s deeply intertwined with statistical analysis and model-building. It’s the first, essential stage before we can do any serious inferencing or prediction.
What’s fascinating is how EDA plays a huge role in fields like Operations Research (OR), too. Think queuing systems, reliability theory, or time series forecasting — all of these benefit from a thoughtful exploration of the underlying data before any formulas get involved.
So what do we actually do during EDA? A lot, actually. We check data quality, look at statistical summaries, visualize the data in meaningful ways, and sometimes go a step further using techniques like Principal Component Analysis (PCA) to uncover deeper structure. It’s a mix of basic instincts and sophisticated tools.
To achieve EDA’s first goal — describing the data — we often start by summarizing it and identifying the key features worth paying attention to. But here’s a warning: sometimes the journey stops here. If the data quality is poor, there’s no point going further. You simply can’t make valid inferences from messy, unreliable data.
In Operations Research, however, the second goal of EDA becomes even more crucial: generating hypotheses, formulating the right model, and choosing appropriate statistical methods to analyze the data. This is where EDA moves from surface-level summary to real strategic insight.
Building a good model involves three main steps: formulation, estimation, and validation. Yet, most statisticians tend to focus heavily on estimation — adjusting parameters for an already-assumed model. But here’s the twist: the hardest part is often the first — figuring out what model to use in the first place. This applies to OR as well, where tweaking existing models often takes precedence over crafting the right one.
Lately, there’s been a growing interest in the last step — model validation. Statisticians are digging deeper into diagnostic tools and residual analysis to ensure their models actually hold up under scrutiny.
At the end of the day, coming up with a meaningful model requires both theoretical grounding and hands-on data exploration. It’s not just about stats or code — it’s about understanding the story the data is trying to tell.
This post is inspired by Chris Chatfield’s classic 1986 article, Exploratory Data Analysis, published in the European Journal of Operational Research. It’s a brilliant primer on how to use EDA to bridge the gap between raw data and real-world insight.
📘 Reference:
Chatfield, C. (1986). Exploratory Data Analysis. European Journal of Operational Research, 23, pp. 5–13.

Leave a Reply